In physical product businesses, inventory is often the single largest asset on the balance sheet. However, many founders mistakenly view large stockpiles as a sign of security. In reality, sitting inventory represents trapped cash—capital that cannot be used for marketing, hiring, or expansion until those goods are sold.
What is the Inventory Turnover Ratio?
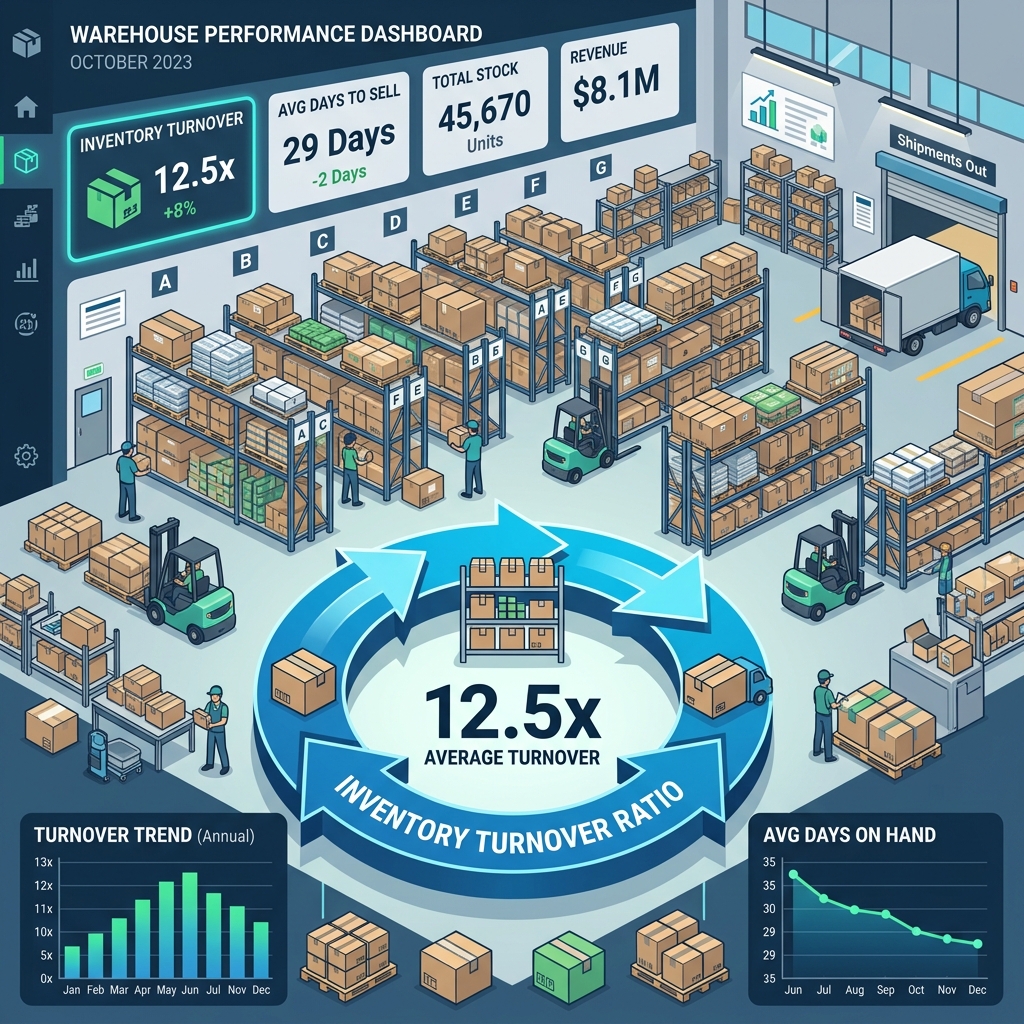
The Inventory Turnover Ratio measures how many times a company has sold and replaced its entire stock of goods over a given period (usually a year). A high turnover ratio typically indicates strong sales and efficient purchasing, while a low ratio points to weak sales and excess, potentially obsolete inventory.
How to Calculate It
To calculate it, divide your Cost of Goods Sold (COGS) by your Average Inventory Value during that same period. For example, if your COGS for the year was $500,000 and you held an average of $100,000 in inventory at any given time, your turnover ratio is 5. This means you sold out and restocked your entire warehouse 5 times that year.
If your ratio is too low, you are paying excessive holding costs (storage, insurance, depreciation) and risking dead stock. If it is too high, you risk stockouts and losing angry customers to competitors.
To pinpoint the exact optimal level for your specific industry, use our free Inventory Turnover Calculator.
Understanding the Core Economics of Business Operations
When analyzing inventory turnover ratio: managing cash tied up in stock, it becomes immediately apparent that traditional methodologies are often insufficient. The modern business environment requires a highly analytical approach to business operations. By diving deep into the numbers, companies can unlock unprecedented growth trajectories and secure a dominant position in their respective markets.
The Strategic Advantage
In today's highly competitive business landscape, optimizing this aspect of your operations is no longer optional—it is a critical driver of long-term sustainability. Companies that fail to adapt to modern quantitative metrics often find themselves losing market share to more agile competitors. By leveraging precise financial modeling and operational tracking, management teams can uncover hidden inefficiencies that would otherwise erode profit margins over time.
Furthermore, the integration of real-time analytics allows for dynamic resource allocation. Instead of relying on gut feelings or quarterly historical data, modern enterprises can pivot their strategies weekly. This proactive approach ensures that capital is always deployed where it generates the highest return on investment, effectively maximizing shareholder value while minimizing exposure to macroeconomic volatility.
Key Metrics to Monitor
To successfully implement this strategy, organizations must establish a robust framework of Key Performance Indicators (KPIs). The most crucial metric is the velocity of capital return—understanding exactly how many days it takes for an invested dollar to generate revenue. This cycle time directly impacts liquidity and determines how aggressively a company can scale its operations without requiring external financing.
Additionally, tracking customer acquisition costs against lifetime value provides a clear picture of marketing efficiency. When these metrics are viewed holistically alongside operational overhead, leadership can identify the exact leverage points needed to accelerate growth. It is this granular level of data analysis that separates market leaders from stagnant businesses.
Common Pitfalls and How to Avoid Them
One of the most frequent mistakes companies make is focusing entirely on top-line revenue growth while ignoring the underlying unit economics. A business can double its sales year-over-year, but if the variable costs associated with that growth scale at the same or a higher rate, the company will eventually face a cash flow crisis. Profitable scaling requires a disciplined approach to cost control and margin preservation.
Another common pitfall is the failure to account for seasonal fluctuations and macroeconomic trends. Building a robust financial model requires stress-testing your assumptions under various worst-case scenarios. By maintaining a conservative cash reserve and negotiating flexible terms with suppliers, businesses can build a moat that protects them during economic downturns.
Implementing the Strategy
Execution is where most theoretical frameworks fall apart. To successfully integrate these concepts into your daily operations, it is essential to foster a culture of financial literacy across all departments. When marketing, sales, and operations teams understand how their specific actions impact the company's bottom line, they can make more autonomous, financially sound decisions.
Finally, leveraging automated tools and calculators can significantly reduce the cognitive load on your executive team. By building standardized models for pricing, inventory turnover, and employee compensation, businesses can eliminate human error and ensure that every strategic decision is backed by hard, irrefutable math.
Conclusion
Mastering the intricacies of inventory turnover ratio: managing cash tied up in stock is a continuous journey of refinement and optimization. By utilizing the free financial calculators available on BizMetricsHub, you can take the guesswork out of your strategic planning and build a fundamentally resilient business.